Content index
Bathymetry is the measurement and graphic representation of the shape or relief of underwater surfaces. These surfaces include the seabed as well as the bottoms of watercourses, reservoirs, etc.
Simplifying a more or less complex problem depending on the dimensions of the area, we can conceive of bathymetry applied to the marine environment as the set of measurements that start from a horizontal reference surface (e.g. the sea surface) and go to the seabed.
Bathymetry measures distances in submerged areas covered by seawater, usually using a point at mean sea level as a reference. Topography, on the other hand, is concerned with measuring landforms, although they use quite similar techniques.
The primary purpose of bathymetry is to ensure safe navigation by providing a detailed mapping of the nature of the seabed and underwater relief, highlighting areas that are rough and dangerous for vessels. This objective is evident in access to ports or areas sheltered from waves and wind near the coast, where the depth is shallower than in the open sea, but also in open sea areas where there are shallows where ships are at risk of running aground or becoming stranded. They are also very useful for rescue and life-saving operations.
In addition to facilitating navigation, bathymetry or, in a broader sense, marine cartography, is used to design, build and monitor sewage outfalls, underwater pipelines, electrical or communications cables, ports and civil engineering works; it can also be useful for other socio-economic and sporting activities such as fishing, shellfishing, surfing or diving.
Fundamentally, it requires two main elements: a positioning system in the plane of the earth’s surface (the coordinates in the horizontal plane, the positioning provided by a GPS today) and a system for measuring the distance from a reference point to the bottom (the vertical coordinate allows us to measure the depth or elevation as it is known in topographic jargon).
GPS positioning systems are now fully standardised and widespread. However, not so long ago, knowing the exact position of a ship that was carrying out a bathymetric survey required enormously complex and expensive instruments, as well as sophisticated astronomical and mathematical knowledge.
In the past, the most common methods for measuring depth were the pole and the sounder. The probe consisted of a plumb line using a line on which sections of equivalent length (fathoms, metres, for example) were marked. A weight hangs from the line to ensure that the system descends vertically, until it is felt to touch bottom.
For years, all vessels have been equipped with electronic sounders that emit a pulse or acoustic signal. Depending on the time elapsed between the emission and reception of the echo produced when the signal bounces off the seabed, and knowing the speed at which the wave is transmitted through the water, it is possible to calculate the distance in a simple way.
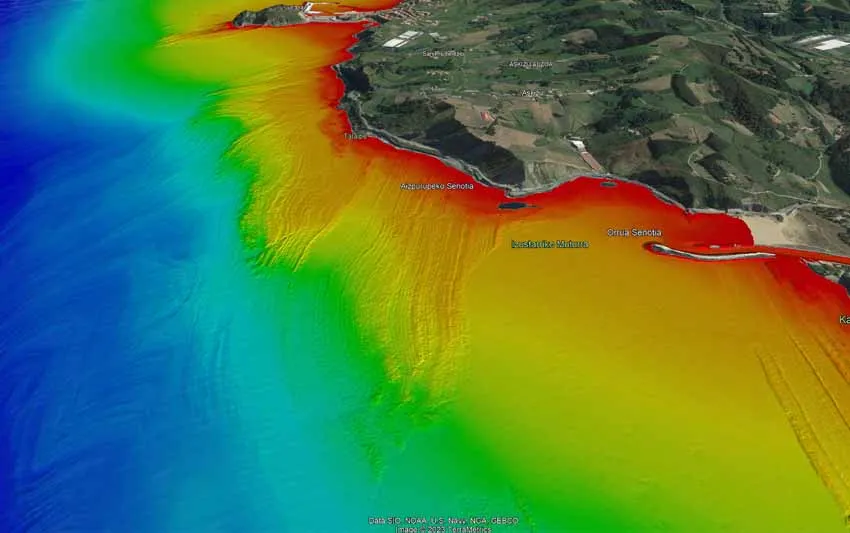
Multibeam sounder systems are used in bathymetric survey work, which send out a beam or fan of signals with very high density and allow to map the area much more quickly from real data. In addition, the whole system is highly computerised, which facilitates the acquisition of plan position (x,y or latitude-longitude coordinates) and depth data in a practically continuous manner.
Bathymetric charts are represented using systems similar to those used for topography, i.e. maps, which in this field are often called nautical charts, bathymetric charts or simply charts. The older ones are admired for their high historical value and beauty. Until a few decades ago, navigation was carried out on the basis of these maps that represented the location of singular elements of the coastline (peaks, lighthouses, bays, towns, churches, castles, etc.) and on the experience and knowledge of seafarers, who could orient themselves by combining these charts with basic geometric knowledge.
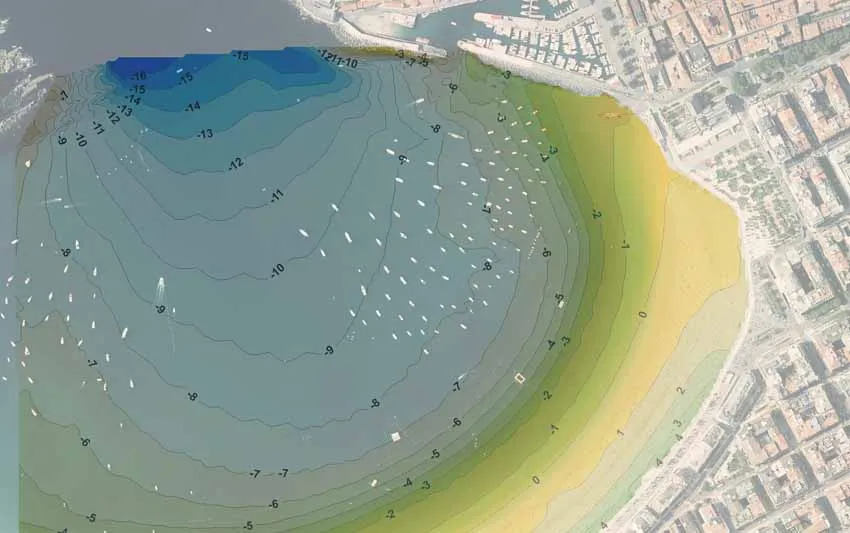
Nowadays, nautical charts show contour lines or lines of equal depth and, in addition, points or soundings where the depth and, almost always, the type of bottom (rock, gravel, sand or mud) are indicated.
As happens in terrestrial cartography, more and more navigators and digital representation systems are being used. However, the use of paper charts is still quite common, both in small, sport or leisure vessels that sail without electronic devices, and in larger vessels for emergency situations or in the event of a power failure that makes the use of electronic charts impossible.