Blue Fishing Index (BFI) is a comprehensive tool designed to assess the contribution of a fishing segment or cluster (a group of vessels sharing similar characteristics – technology, length, fishing ground) to fisheries sustainability.
The Blue Fishing Index (BFI) is a tool developed by AZTI in collaboration with the Universidad de Santiago de Compostela (USC) to objectively and comparatively measure the environmental, economic, and social contribution of each fishing segment or cluster. Its purpose is to provide a scientific basis to support continuous improvement in the sustainability of European fleets and to anticipate risks of imbalance in their overall performance.
El BFI es un sistema de evaluación a partir del cual estimar en qué grado cada segmento de pesca contribuye a un crecimiento sostenible, es decir, un crecimiento económico que respeta el medioambiente, y las condiciones sociales de los pescadores en un entorno de cambio climático. Se trata de una evaluación en términos relativos que permite conocer cómo evoluciona cada segmento de pesca a lo largo del tiempo, pero también su situación relativa respecto al resto de clústers en términos de crecimiento sostenible. .
The BFI is an assessment system used to estimate the extent to which each fishing segment contributes to sustainable growth — that is, economic growth that respects the environment and the social conditions of fishers in a context of climate change. It is a relative assessment, allowing users to: Track how each fishing segment evolves over time; Compare its position relative to other clusters in terms of sustainable growth
Its structure is based on a clearly defined framework composed of:
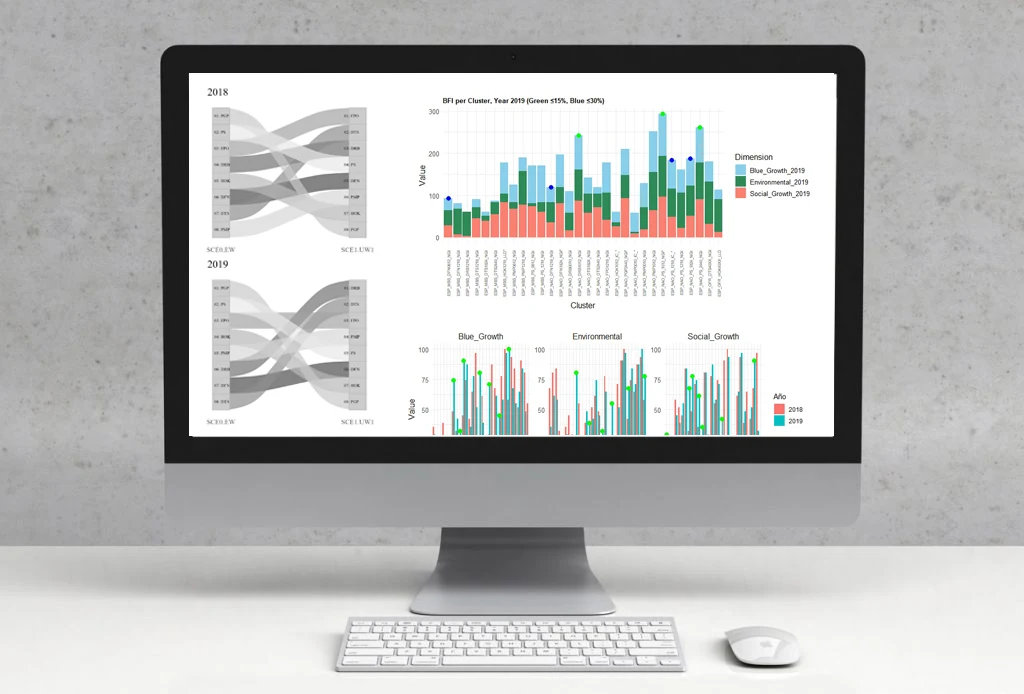
Through this architecture, the BFI provides a balanced and detailed view of fisheries performance, showing how each component — from stock status to working conditions or energy efficiency — contributes to overall sustainability.
The BFI applies normalization and weighting methods to build a robust composite index that simultaneously integrates multiple dimensions, each broken down into indicators and variables within a coherent conceptual framework.
It is built around three main pillars:
1. Structured methodological framework
Constructed from dimensions, indicators, sub-indicators, and variables covering:
2. Weighting and sensitivity analysis
The tool allows comparison of different methodological scenarios:
This enables users to test the robustness of results and understand how scores vary under different management assumptions. Stakeholders themselves can decide which scenario or weighting scheme to apply.
3. Relative positioning through percentiles
Each cluster receives a relative score reflecting its position compared to all evaluated fleets.
This approach helps identify:
Results can be visualized interactively, enabling fleet comparisons, scenario exploration, and sustainability trend analysis.
Sectors: Fisheries and aquaculture sector
Research lines: Blue Economy, Efficient, sustainable fisheries and aquaculture
Research sublines: Sustainable fishery management